
The Complete Blood Count test, also known as the CBC is one of the most common lab tests ordered by medical providers. If you have ever had a panel of labs run on you while you were sick, this was likely one of them. This is for good reason, because the CBC panel includes 20 individual tests that each provide a wealth of information about your body’s health to the doctor. Lets do a deep dive and explore the significance of what each test on this panel means in relation to the overall picture.
Purpose of the Complete Blood Count (CBC) Test
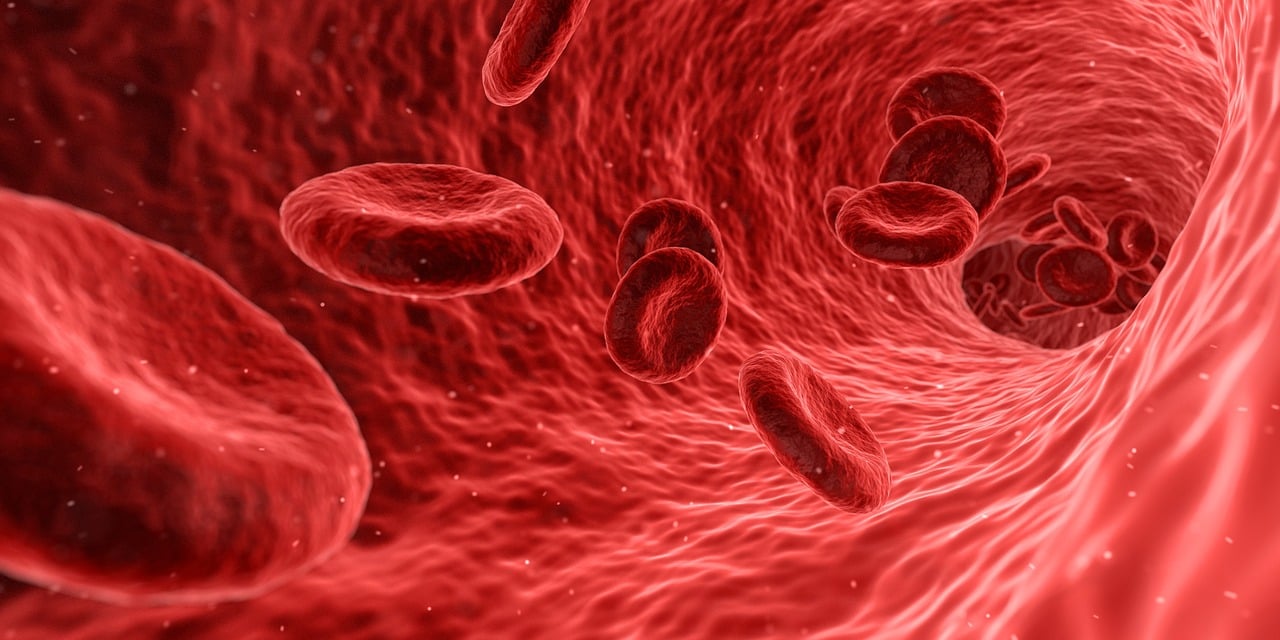
The CBC test is a measure of the primary cellular components of whole blood. These include white blood cells, red blood cells and platelets. This gives information about the body regarding immunity, oxygenation and hemostasis, making it a highly versatile and useful test for clinicians when diagnosing disease and monitoring general health. Each test has a reference range, which is an agreed upon normal range that hospitals set according to their patient population. This can vary widely based on location, so in this case, we will use Davis’s 2019 Comprehensive Manual of Laboratory & Diagnostic Tests as an approximation for each test’s reference ranges and critical limits.
Complete Blood Count (CBC) Specimen Management
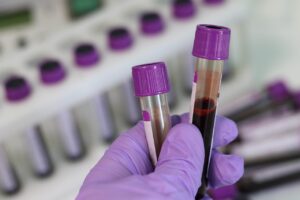
The preferred specimen for running a CBC, is whole blood anticoagulated with EDTA. This is most commonly drawn from a peripheral vein into a 3-4 ml purple top vacutainer tube in adolescents and adults. For neonates, a 0.5 ml purple top “Pedi-tube” can be collected from a heel-stick.
Purple tops should be inverted several times immediately upon collection to ensure the EDTA mixes thoroughly with the sample. If proper mixing is not done, the blood can clot up very quickly. If the lab receives a specimen that is clotted, this is grounds for rejection, and a new sample will need to be re-drawn. If a clotted sample slips through and gets run anyways, erroneous results can occur since cells like platelets and red blood cells can get pulled in by the clot, causing artificially low results. Additionally, if a clotted specimen does make it to the testing stage, the clots can obstruct the probes and tubing of the CBC analyzer, causing a delay in testing for other samples while maintenance is performed to unclog the instrument.
Once a tube of blood is collected and centrifuged, its easy to see the makeup of the cellular elements. The red blood cells have the greatest density, so they will sink to the bottom and take up 40-50% of the whole blood’s volume. The plasma remains on top and takes up another 40-50% of volume. Sitting on top of the RBCs is a thin grey-whitish colored layer called the “buffy coat”, which consists of white blood cells and platelets. The buffy coat usually comprises about 1% of the volume. These RBCs, WBCs and platelets are the 3 lines of cells which the CBC test analyzes in detail.
CBCs can be run utilizing both automated and manual methods, although they are typically run using an automated method due to the high volumes of workload normally required.
The main difference between automated and manual methods is speed. Automated methods use a technology called flow cytometry which is capable of counting ~10,000 cells per minute1. With manual methods, a device called a hemacytometer must be used for the cell count portion and a tabletop counter is used for the differential portion, making for a much slower analysis process.
Another difference in methods is that automated analyzers can perform indices calculations very quickly once they have measured certain base parameters. Whereas with the manual method, calculations must be done by hand, adding considerable time to the process.
It is for these reasons that automated methods like the Beckman Coulter LH 500, among other popular platforms, are vital for providing CBC results quickly when doctors need it.
White Blood Cell Results
White Blood Cell (WBC) Count
These are the cells responsible for protecting the immune system against pathogens like bacteria, viruses and parasites. A normal WBC count ranges between 4.8-10.8 x 10³ul (microliter).
High WBC Count: When a WBC Count is high, this is called “leukocytosis” and is often caused by some sort of infection. In response to a pathogen, the body produces “leukocytes” to seek out the organisms and destroy them.
Low WBC Count: When a WBC Count is low, this is called “leukopenia” and can be caused by a number of things including chronic infection where the body’s bone marrow struggles to keep up with production. Things like cancer, certain medications and autoimmune disorders can all wipe out a person’s supply of white cells, leaving them open to weakened immunity.
However, a low WBC Count doesn’t always have a negative implication. Sometimes, there are cultural trends which can have an effect on result demographics. For example, some studies have found that African Americans have lower baseline numbers of WBCs than non-African Americans, a condition called “benign ethnic neutropenia”. This is why doctors should consider the racial component as well, when considering treatment based off of CBC results2.
WBC Differential
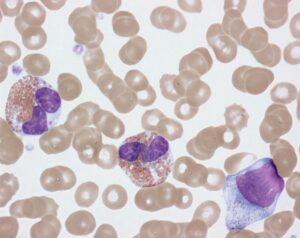
A WBC differential is a breakdown of the different sub-types of white cells in a person’s blood. Different proportions of each sub-type can signify certain diseases and conditions. Cells can be categorized using either automated or manual methods.
When using automated methods, a flow cytometer will measure the quantities of each type of cell very rapidly. But with the manual method, techs must count 100 WBCs on a Wright-stained slide under a microscope and group them one by one using a tabletop counter. When the sums of each WBC subset are totaled up at the end, they should add up to 100.
Also, each WBC subset will be accompanied by an Absolute Count result, for a total of five Absolute Counts. This is basically the raw quantity of cells counted, as opposed to a “percentage” or “proportion”. Absolute Counts can be high or low depending on the condition. Normal ranges will differ between age groups, but we will focus on those aged 11 years and older below.
Neutrophil Percentage
The main function of neutrophils is to phagocytize bacteria. They are the most common WBC found in the body and make up the majority of white cells in a healthy patient. A normal neutrophil percentage in a differential is between 40%-75%.

Neutrophil Absolute Count
The range for neutrophil absolute count is between 2.7-6.5 x 10⁹/L.
Lymphocyte Percentage
The main function of lymphocytes is to fight viral infections. There are three main types of lymphocytes: T Cells, B Cells and Natural Killer Cells. Unlike neutrophils which have a short life, lymphocytes live much longer lives. This is necessary since their main purpose is to “remember” past interactions with pathogenic cells from months or even years ago. A normal lymphocyte percentage in a differential ranges between 12%-44%.
Lymphocyte Absolute Count
The range for normal absolute lymphocyte count is between 1.5-3.7 x 10⁹/L.
Monocyte Percentage
The function of monocyte is two-fold since it can differentiate into both dendritic cells as well as macrophages once outside of the bone marrow.
Dendritic cells collect the antigen information of invading germs and release “cytokines” which signal other WBCs to move to the infection site to assist with destroying the pathogen3.
Macrophages phagocytize viruses, bacteria, fungi and protozoa by engulfing them, similar to neutrophils.
A normal monocyte percentage in a differential ranges between 4% – 9%.
Monocyte Absolute Count
The range for normal absolute lymphocyte count is between 0.2-0.4 x 10⁹/L.
Eosinophil Percentage
Eosinophils primary purpose is to protect the body from parasites, fungi and allergens in the body. These are rarely seen, hence a normal eosinophil percentage ranges between 0% – 5.5%.
Eosinophil Absolute Count
The range for normal absolute eosinophil count is between 0.05-0.5 x 10⁹/L.
Basophil Percentage
Basophils are seen during allergic reactions, where they release histamine to improve blood flow, quickly causing physical symptoms like itchiness, runny nose and watery eyes. An enzyme called heparin is also released in order to help prevent the blood from clotting. These are the most seldom seen WBCs to be seen in a differential, making for a normal basophil percentage between 0% – 1%.
Basophil Absolute Count
The range for normal absolute basophil count is between 0-0.1 x 10⁹/L.
Red Blood Cell Results
Red Blood Cell Count
The RBC count tells us how many red cells are in a given volume of whole blood. RBCs transport hemoglobin throughout the body, so that tissues can be delivered oxygen and carbon dioxide can be taken away back to the lungs for processing. Red blood cells are produced in the bone marrow and only live for about 120 days once they are released into circulation. Once they have met their life expectancy, they are removed from circulation by the spleen.
Normal RBC Count
Men naturally have higher RBC counts than women. Therefore, the normal range for male RBC count is 4.21-5.81 x 10⁶ /uL and the normal female RBC count is 3.61-5.11 x 10⁶ /uL.
Low RBC Count
Low red blood cell count is the main cause of anemia. This can be caused by several factors like excessive blood loss, as well as production and destruction issues.
High RBC Count
High red blood cell count is also known as Polycythemia Vera. This can cause a person’s blood to become very thick, eventually requiring treatments like therapeutic phlebotomies in order to provide relief. This has both natural and man-made causes.
Natural: Some patients who are heavy smokers will produce more RBCs in order to compensate for the lack of oxygen typically suffered by that population. Also, those who live at very high altitudes may experience high RBC counts in order to compensate for the low levels of dissolved oxygen available in the air in those regions.
Man-Made: There are people, particularly competitive and super-elite athletes, who use blood transfusions or erythropoietin injections in order to force an increase in the amount of red blood cells in their blood. This provides them with additional oxygen carrying benefits, allowing them to work harder and faster than their natural counterparts. However, this act of “blood doping” is both illegal and dangerous to the athlete, due to the risk of circulatory overload and myriad of heart issues that can arise.
Hematocrit
A person’s hematocrit is the percentage of their packed red blood cells in proportion to their total whole blood volume. Many of the same causes of low and high hematocrit mirror the same origins of what causes low and high RBC count. The normal range of hematocrit for males is between 42% to 52% and for non-pregnant females is 36% to 48%. Pregnant females are between 35% to 42% in the first trimester, before dropping down to 28% to 33% in the second and third trimester, due to dilutional effects in their circulation.
Low Hematocrit can be caused by:
-Blood loss: menstruation, chronic/acute hemorrhage
-Decreased RBC production: due to nutritional deficiency
-Increased RBC destruction: certain medications, sickle cell disease.
-Dilution: congestive heart failure, pregnancy, overhydration, hemodilution from IV fluid administration.
-A critical low result for hematocrit is less than 19.8%.
High Hematocrit can be caused by:
-Low oxygen levels: smoking/vaping, high altitude, carbon monoxide exposure.
-Dehydration: vomiting, diarrhea, sweating, burns.
– A critical high result for hematocrit is greater than 60%.
Hemoglobin
Hemoglobin (Hgb) is the substance carried on red blood cells that is responsible for transporting oxygen throughout the body. The word hemoglobin is derived from the base prefixes “Heme” which is the iron portion of the molecule and the “globin” portion is the protein portion. Hemoglobin is what gives oxygenated blood its bright red color.
Normal hemoglobin levels for males range from 14-17.3 g/dL and 11.7-15.5 g/dL in non-pregnant females. Pregnant females run between 11.6-13.9 g/dL in the first trimester, before dropping down to 9.5-11 g/dL in the second and third trimester.
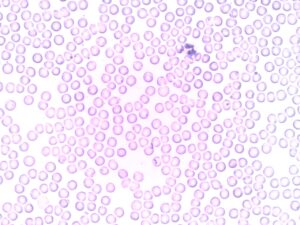
When looking under a microscope, red blood cells with normal hemoglobin levels are referred to as “normochromic” and will have a clear central area of pallor, typically about 1/3 the width of the cell.
Low Hemoglobin
Red blood cells with lower hemoglobin levels will be considered “hypochromic” and will have an increased area of central pallor, due to their lower oxygenation levels. A critical result for low hemoglobin is less than 6.6 g/dL.
High Hemoglobin
Those with higher hemoglobin levels will be considered “hyperchromic” and will have less central pallor. A critical result for high hemoglobin is more than 20 g/dL.
Rule of 3: One of the general rules in hematology is known as the “Rule of 3”. This basically says that the Hemoglobin should be about 3 times the RBC Count and the Hematocrit should be around 3 times the Hemoglobin. For example: For example, an RBC Count of 5.0 x 10⁶ /uL should equate to a Hemoglobin of 15.0 g/dL, which in turn should result in a Hematocrit of 45%. When the Rule of 3 does not add up as it should, this may be an early clue that there is an abnormality with the RBCs such as hypochromia, hyperchromia, microcytosis or macrocytosis.
Critical Indicator for Transfusion: There are many things that a doctor looks at when deciding to transfuse a patient with blood. But one of the most important factors for them to consider is the hemoglobin. The lower that a patient’s hemoglobin is, the more likely they are to be transfused. An important thing to consider is that this number will be different for everybody. I have seen patients with results as low as 3 g/dL that were able to remain alert, whereas with other patients, a result this low would put them in critical condition and possibly in a coma.
Additionally, the level of hemoglobin can serve as an indicator for the likelihood of transfusion in many cases.
In my facility, when we see a patient has a hemoglobin of 7.0 g/dL or less, we consider them highly likely to get transfused, therefore we will assign a short dated (soon to expire) unit to that patient, in order to maximize inventory.
For every unit of packed RBCs that is transfused to a patient, the hemoglobin will be elevated by 1 g/dL. When comparing baseline hemoglobin levels with present levels, this can give doctors a guideline as to how many units of blood a patient may need.
MCV
The MCV blood test stands for “Mean Corpuscular Volume” and is a measurement of the average size of the red blood cells in the body. It is a useful test for identifying various types of anemias as well as calculating another CBC parameter, the “RDW”. The MCV is calculated from the hematocrit and the red blood cell count4:
Formula: MCV= Hct x 10/ RBC (1012/L)
Example: 45 x 10/5.0= 90 femtoliters (fL).
The MCV normal range for adult males will fall between 79-103 fL and the range for adult females will be slightly lower between 78-102 fL.
Low MCV
This means the average red blood cell is smaller than it should be and may point to some form of Microcytic Anemia like iron deficiency anemia, thalassemia, anemia of chronic inflammation and sideroblastic anemia5.
High MCV
This is seen when the patient’s red blood cells are larger than normal and may indicate a form of Macrocytic Anemia. Macrocytic anemias are classified as either megaloblastic or non-megaloblastic forms. Megaloblastic anemia is due to impaired DNA synthesis from folate and/or vitamin B12 deficiencies, while non-megaloblastic varieties occur from alcoholism, hypothyroidism, liver disease, hemolysis, pregnancy or bone marrow disease.
Normocytic Anemia: Even when MCV results are within normal ranges, there can still be signs of normocytic anemia. This can be caused by things like erythropoietin deficiency or acute blood loss.
MCH
The MCH blood test stands for “Mean Corpuscular Hemoglobin” and is a measurement of the amount of hemoglobin per red blood cell. It is a useful test for identifying various types of anemias. The MCH is calculated from the hemoglobin and the red blood cell count7.
Formula: MCH= Hgb x 10/ RBC (1012/L)
Example: 12.0 x 10/5.0= 24 picograms (pg/cell).
The MCH normal range for both adult males and females will be between 27-35 pg/cell.
Low MCH can indicate iron-deficiency anemia while a high MCH can often suggest anemia due to nutritional deficiencies low folic acid or vitamin B12 levels8.
MCHC
The MCHC blood test stands for “Mean Corpuscular Hemoglobin Concentration” and is a measurement of hemoglobin per unit volume. It is a useful test for identifying various types of anemias. The MCHC is calculated from the hemoglobin and the hematocrit9.
Formula: MCHC= Hgb x 100/ Hct
Example: 12.0 x 100/ 38= 31.5 g/dL.
The MCHC normal range for both adult males and females will be between 32-36 g/dL.
Low MCHC
Having a low MCHC may indicate Iron deficiency anemia or thalassemia10.
High MCHC
A higher than normal MCHC result may mean you have hemolytic anemia, a type of anemia that happens when red blood cells are broken up in the blood stream. A high MCHC can also be a sign of “hereditary spherocytosis”, a genetic disorder that causes anemia and gallstones11.
RDW
The RDW blood test stands for “Red Cell Distribution Width” and is a measurement of the variation in size of RBCs, or “anisocytosis” in the body, as opposed to the average size of RBCs that MCV measures. It is a useful test for identifying various types of anemias. The RDW is calculated from dividing the standard deviation of the average RBC size by the MCV and then multiplying by 100 to convert to a percentage12.
Formula: RDW= SD of MCV x 100/ MCV
The RDW normal range for both adult males and females is between 11.6-14.8%.
Low RDW
A low RDW simply means that there is little variation in the size of RBCs. All RBCs should be very similar in size with a healthy person anyways, so this is not alarming to see. However, having low variation in size doesn’t necessarily equate with the RBCs being “normal” size. In some cases, they could be uniformly small or uniformly large. In these cases, it may be smart to look at the MCV as well and compare the results together.
High RDW
A higher than normal RDW result, signifies “anisocytosis” and is seen in patients with various forms of microcytic and macrocytic anemia. It can also be seen in individuals who have recently received blood transfusions since they will have multiple populations of donor cells circulating with their own cells.
Platelet Results
Platelet Count
The platelet count is a measure of the round discs in the blood which serve to stop bleeding by forming a platelet plug. Measuring the number of platelets circulating in the blood can be useful in monitoring the body’s hemostasis and coagulation functions.
The normal range for a platelet count is between 140-400 x 103 /ul.
Consider that even if you have a normal platelet count, you can still be at risk for a bleeding disorder. This is because platelets, despite being sufficient in number may not be functioning properly. One or more of the primary platelet functions (activation, adhesion & aggregation) can be faulty, rendering them as less effective.
Low Platelet Count
A low platelet count, also known as “thrombocytopenia” is observed when the body’s demand is greater than the rate of production can keep up with. This can be caused by acute or chronic blood loss, cancer, certain medications and alcoholism. In severe cases, platelet transfusions may be necessary.
A critically low platelet count result is considered 30 x 103 /ul or less and can result in excessive bleeding and bruising if not fixed.
One thing to consider is that there are several possible causes of false thrombocytopenia. Things like platelet clumping, satellitism and giant platelets can cause automated counters to overlook them due to discrepancies in size as well as their atypical arrangement. A manual count by a lab technician would be needed to confirm these scenarios.
High Platelet Count
A high platelet count, also known as “thrombocytosis” can be caused by inflammation, infection, cancer, anemia and even a splenectomy.
A critically high platelet count result is considered 1,000 x 103/ul or higher. Uncontrolled thrombocytosis can increase the risk of blood clots throughout the body and can result in a stroke or heart attack in some instances.
MPV
The Mean Platelet Volume “MPV” is a measure of the average size of platelets circulating in the blood.
The normal range for Mean Platelet Volume is between 7.1 – 10.2(fl).
Low MPV
A low Mean Platelet Volume is caused when the average platelet size is smaller than normal. If low numbers are observed, this may be due to tuberculosis, ulcerative colitis, lupus, and neoplastic diseases13.
High MPV
A high Mean Platelet Volume is caused when the average platelet size is larger than normal. Newly made platelets are larger than older ones, so if high numbers of larger ones are being seen, it is presumed that there is increased destruction of mature thrombocytes due to cardiovascular diseases, cerebral stroke, respiratory diseases, chronic renal failure, intestine diseases, rheumatoid diseases, diabetes, and various cancers14.
Manual Differential & Pathologist Review
When CBCs are ran, a majority of them are considered normal. In this case, the results are certified and filed away. But when certain results flag as abnormal, this will trigger a manual differential to be added on as well.
During a manual differential, a slide will be made with the appropriate stain (usually Wright Stain) and it will be examined under a microscope. A manual differential will require counting of each type of WBC, grading of RBCs to determine if they are normocytic/normochromic or not, observing any RBC inclusions, and determining a platelet estimate. Other common anomalies like nucleated RBCs, banded neutrophils and any other immature cells should be annotated as well.
During the manual differential, certain things like seeing blasts and other immature cells can trigger a review by the next higher echelon, a “Pathologist Review”. A Pathologist is a doctor that specializes in pathology/laboratory medicine and has a higher level of training than the lab technicians and technologists. Because of this, anything deemed by the lab as above the skill level of the lab technician/technologist, will get sent for a Pathologist Review. For example, any WBC in my lab that was more immature than a banded neutrophil triggered a Pathologist Review. Once the pathologist reads the slide, they will send their results to the patient’s doctor and will relay anything pertinent that they saw when reading the slide. The outcomes can range from cancer to something more benign or transient.
Conclusion
The CBC is easily one of the top 3 lab tests ordered by medical providers. The information that it provides, gives a wealth of information about the body’s immunity, oxygenation and hemostasis functioning. This continues to make it a useful test for clinicians when diagnosing disease and monitoring general health.
References
1.Flow Cytometry. (2021, November 17). Retrieved from Cleveland Clinic: https://my.clevelandclinic.org/health/diagnostics/22086-flow-cytometry
2.Reich D, N. M. (2009, January 5). Reduced Neutrophil Count in People of African Descent Is Due To a Regulatory Variant in the Duffy Antigen Receptor for Chemokines Gene. Retrieved from National Library of Medicine: https://www.ncbi.nlm.nih.gov/pmc/articles/PMC2628742/#:~:text=Many%20African%20Americans%20have%20white,be%20analyzed%20to%20assign%20probable
3.Monocytes. (2021, November 28). Retrieved from Cleveland Clinic: https://my.clevelandclinic.org/health/body/22110-monocytes
4,7,9.Red Blood Cell (RBC) Indices: Definitions and Calculations. (n.d.). Retrieved from Lab CE: https://www.labce.com/spg579119_red_blood_cell_rbc_indices_definitions_and_calcula.aspx
5. Julie L. Meredith, M., & Nancy S. Rosenthal, M. (1999, August). Differential Diagnosis of . Retrieved from Laboratory Medicine: https://web.archive.org/web/20180728054415id_/https://watermark.silverchair.com/labmed30-0538.pdf?token=AQECAHi208BE49Ooan9kkhW_Ercy7Dm3ZL_9Cf3qfKAc485ysgAAAa8wggGrBgkqhkiG9w0BBwagggGcMIIBmAIBADCCAZEGCSqGSIb3DQEHATAeBglghkgBZQMEAS4wEQQMrcBZmRXSOoBk-hVJAgE
6.Moore, C. A., & Adil., A. (2022, July 11). Macrocytic Anemia. Retrieved from National Library of Medicine, National Institutes of Health: https://www.ncbi.nlm.nih.gov/books/NBK459295/
8.Brown, V. (2023, February 6). What is MCH? Retrieved from Health: https://www.health.com/mch-7099097#:~:text=complete%20blood%20count.-,The%20normal%20range%20for%20MCH%20is%2027%20to%2031%20picograms,folic%20acid%20or%20vitamin%20B12.
10,11.Red Blood Cell (RBC) Indices. (n.d.). Retrieved from Medline Plus: https://medlineplus.gov/lab-tests/red-blood-cell-rbc-indices/
12.Red Blood Cell Distribution Width (RDW): Definition and Calculation. (n.d.). Retrieved from Lab CE: https://www.labce.com/spg2114710_red_blood_cell_distribution_width_rdw_definition_a.aspx
13,14.Korniluk A, K.-L. O.-P. (2019, April 17). Mean Platelet Volume (MPV): New Perspectives for an Old Marker in the Course and Prognosis of Inflammatory Conditions. Retrieved from NCBI, National Institute of Health: https://www.ncbi.nlm.nih.gov/pmc/articles/PMC6501263/
Anne M. Van Leeuwen, M. B., & Mickey L. Bladh, R. M. (2019). Complete Blood Count; RBC Count, Indices, Morphology & Inclusions. In M. B. Anne M. Van Leeuwen, & R. M. Mickey L. Bladh, Davis’s Comprehensive Manual of Laboratory & Diagnostic Tests with Nursing Implications, 8th Edition (pp. 370-378; 1025-1035). Lisa B. Houck.