The urine dipstick is a helpful screening test which can give information about the body regarding kidney and liver health, blood sugar disorders, urinary tract infection, bleeding, hydration and general health assessment. The urine dipstick test is typically performed in a clinic or hospital laboratory where it is read manually or with an automated platform like the Clinitek or Iris systems. However, it can also be performed at home due to its simplicity. Keep reading if you want to learn how to read a urine dipstick at home.
How Do Urine Dipsticks Work?

Urine dipsticks are thin strips which contain 8-14 absorbent pads that are impregnated with various chemical reagents. These pads will turn various shades of color once they have been dipped into a urine specimen. The degree of color change will correspond to a scale located on the bottle or box of dipsticks, sometimes even in the package insert. This color scale is what will convert the degree of color change into an actual test result.
How Long Are Urine Specimens Good For?
Urine specimens should be tested as soon as possible after leaving the body, preferably within 60 to 90 minutes at most. After this time, the analytes on the dipstick begin to change, potentially causing false positive or false negative results.
If there will be a delay in between the time you collect the specimen and the time that you are able to read the urine dipstick, place the specimen in the refrigerator until you are ready for testing. This will help to preserve it longer and to minimize results from changing due to the time effect.
How Soon Can You Read Urine Dipstick Results?
This will depend on the manufacturer. Although, you will notice color change immediately after dipping the strip, you will have to wait in order for the chemical reaction to complete to get the final result. Several pads will usually have different reading times, so you will need to check the strip at various times in order to read the entire dipstick. The time range for reading is typically between 30 seconds and 2 minutes.
What If You Don’t Have Enough Urine For The Dipstick?
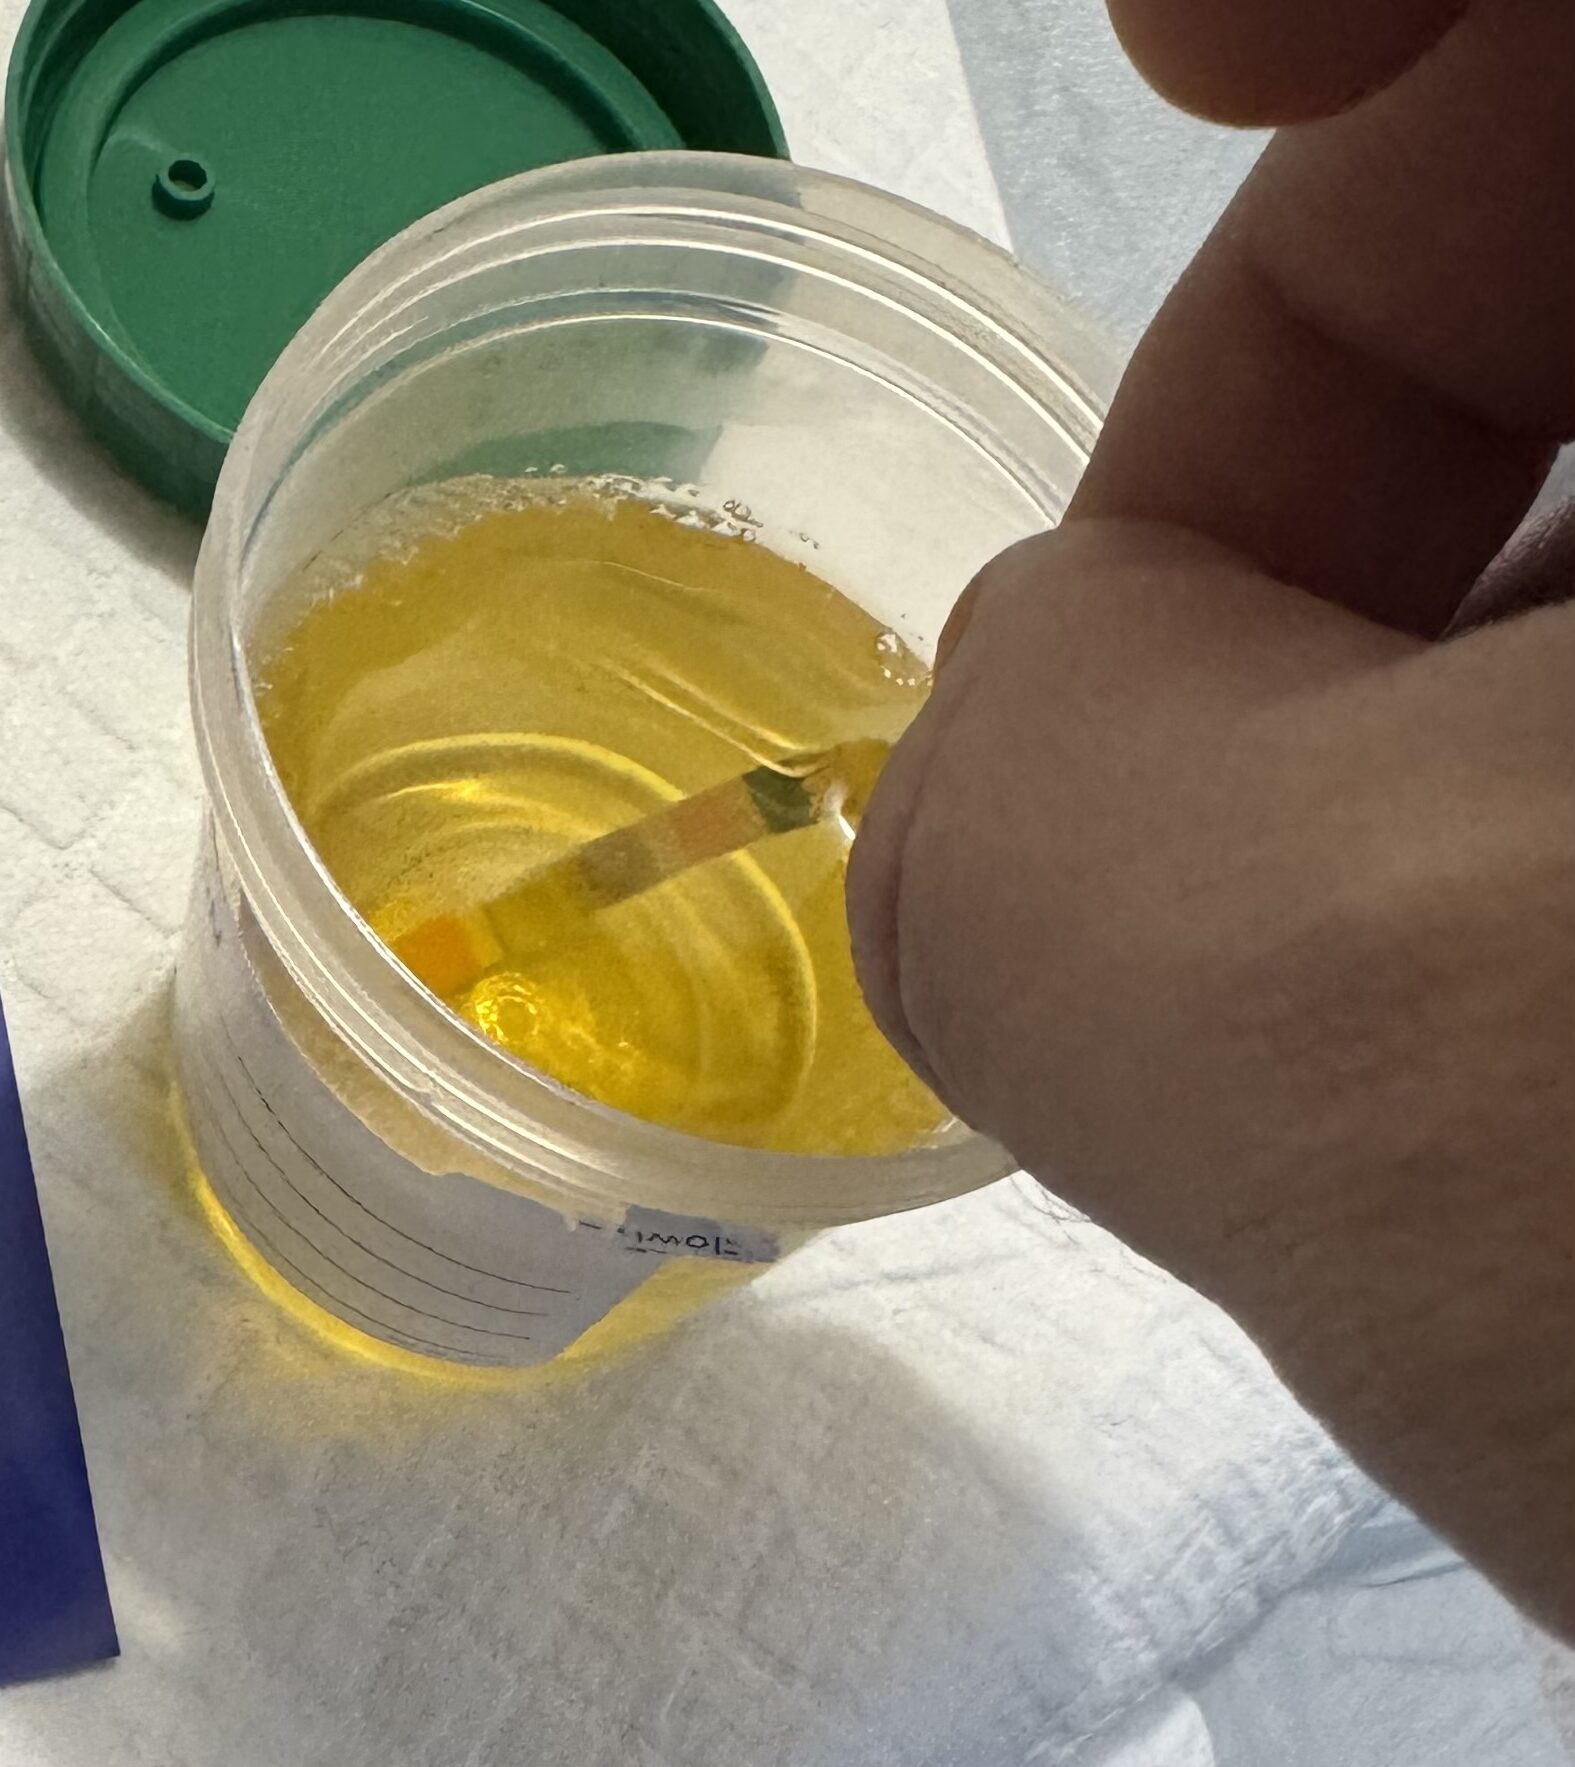
In the event that you were only able to get a small amount of urine in the cup, this makes it very difficult/impossible to dip the dipstick into the urine and adequately cover the absorbent pads. A solution to this is to aspirate the urine with a disposable pipette and expel 1 drop onto each of the absorbent pads while the dipstick is lying flat. As long as you have at least 10 drops to work with, this should be enough to complete testing.
Why Are The Colors On The Dipstick’s Absorbent Pads Mixing With Each Other?
This happens because there is too much urine on the dipstick. When this excess urine remains, it can create a pathway for adjacent pad’s colors to mix with each other, making it difficult to read and causing any results to be erroneous.
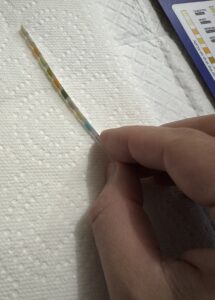
A solution to prevent excess urine interference is to blot using a paper towel. Once you pull the dipstick out of the urine, hold it on its side and touch it to the paper towel for 2 to 3 seconds. The paper towel will draw out the excess urine so that there is just enough remaining for the chemical reactions to take place and it prevent any cross contamination with other pads.

What Tests Can Be Done On a Urine Dipstick?
There are many variations of urine dipsticks, but most of them are capable of performing the following 10 tests: Glucose, Bilirubin, Ketones, Specific Gravity, Blood (Red Blood Cells), pH, Protein, Urobilinogen, Nitrites and Leukocytes (White Blood Cells).
Glucose

Glucose in the urine, or “glycosuria” occurs when the amount of glucose in the body exceeds the ability of the kidneys to reabsorb it.
The urine dipstick will measure glucose in increments from 0 to 110 mmol/L.
A normal urine glucose result should be 0 (negative).
An elevated urine glucose result can be caused by diabetes, Fanconi Syndrome and pregnancy.
Bilirubin

Bilirubin is a yellowish pigment which is produced by the liver after red blood cells have been broken down.
The urine dipstick will measure bilirubin in increments from 0 to 100 umol/L.
A normal urine bilirubin result should be 0 (negative).
An elevated urine bilirubin is usually due to one of several types of liver disease, like cirrhosis or hepatitis. Elevated bilirubin levels are often accompanied by a condition called “jaundice” which is a yellow discoloration of the skin and eyes.
Ketone Bodies

Ketones are made when the body burns fat for energy.
The urine dipstick will measure ketones in increments from 0 to 16.0 mmol/L.
A normal urine ketone result should be 0 (negative).
Elevated ketone bodies are normally seen during fasting, starvation, high-protein diets, inadequate carbohydrate intake and inadequate levels of insulin (diabetic ketoacidosis).
Symptoms of diabetic ketoacidosis include excessive thirst, frequent urination, nausea and fruity breath.
Specific Gravity

Specific gravity is a measure of the concentration of solutes in the urine.
The urine dipstick will measure specific gravity in increments between 1.000 and 1.030 and can vary based on hydration status, activity level and disease progression.
The normal range for most people falls between 1.010 and 1.015. The closer you get to 1.000, the more the urine will look like pure water, due to the lower number of solute particles. The closer you get to 1.030, the hazier it will look due to the increase in solute particles.
A low specific gravity can be due to diabetes, kidney failure, diuretic use, excessive caffeine or alcohol intake or overhydration.
A high specific gravity can be due to diarrhea, vomiting, excessive sweating, UTI, glycosuria, liver disease, congestive heart failure and dehydration.
Blood (Red Blood Cells)

When red blood cells are present in the urine, this is called hematuria.
The urine dipstick will measure red blood cells in increments from 0 to 200 cells/ul.
A normal urine red blood cell result should be 0 (negative).
When hematuria is present, this can be due to urinary tract infections (UTI), kidney stones, kidney disease, bladder cancer and strenuous exercise. Women can also experience hematuria during menstruation.
pH

pH tells you the acidity or alkalinity of a urine sample and is controlled by the kidneys as they excrete hydrogen ions and reabsorb bicarbonate ions. This process helps to maintain an acid-base balance as the body experiences daily challenges which threaten to alter this balance.
Although the actual pH scale goes from 0 to 14, the far ends of this scale are not compatible with human life. Therefore, the urine dipstick will measure pH in increments from 5 to 8.5.
A normal urine pH level is between 5.5 to 6.5.
A low urine pH (acidic) can be due to diabetic ketoacidosis, diarrhea, high protein diet, starvation, COPD, emphysema or pneumonia.
A high urine pH (alkaline) can be due to UTI, kidney failure hyperventilation, vegetarian diet or vomiting. Alkaline urine can also be caused by waiting too long before testing the specimen. This allows bacteria in the urine cup more time to convert urea into ammonia (a highly alkaline byproduct).
Protein

When protein is found in the urine, it is referred to as proteinuria. Normally, protein should not be found in the urine since proteins should be reabsorbed by the kidneys after digestion.
The urine dipstick will measure protein in increments from 0 to 20 g/L.
A normal urine protein result should be 0 (negative).
A high urine protein result can be due to kidney disease. This is seen when kidneys lose their ability to reabsorb protein and it is forced to spill over into the urine to be excreted. High urine protein can also be caused by strenuous workouts or high protein diets. Proteinuria often causes urine to look “foamy”.
Urobilinogen

Your red blood cells contain a protein called hemoglobin which helps transport oxygen throughout the body. When RBCs are broken down in the body, the heme portion is broken down into biliverdin, which is then converted into unconjugated bilirubin, taken up by the liver and then converted into conjugated bilirubin, before it is then excreted into the bile. Next, the intestines convert it back into un-conjugated bilirubin and it is reabsorbed into the bloodstream where it is excreted again into the bile. Whatever isn’t reabsorbed will get reduced into urobilinogen and excreted in the urine.
A normal urine urobilinogen result should be around 0.2-1.0 mg/dL.
A low urine urobilinogen result can be due to bile duct obstruction or antibiotic therapy.
A high urine urobilinogen result is often due to hepatitis, cirrhosis or hemolytic anemia. These are all conditions resulting in increased levels of urobilinogen precursor, bilirubin.
Nitrites

Nitrites are a byproduct from when bacteria convert nitrates into nitrites.
The urine dipstick will measure nitrites in increments, seen by color change from white to various shades of a pink background.
A normal urine nitrite result should be negative.
When urine nitrite tests are positive, it is usually indicative of a urinary tract infection (UTI). However, a negative nitrite result does not necessarily rule out a UTI, since not all bacteria are capable of reducing nitrates into nitrites.
Leukocyte Esterase

Leukocyte esterase is an enzyme which is produced in certain WBCs (neutrophils, eosinophils and basophils), once they have been recruited to the site of an infection.
The urine dipstick will measure leukocyte esterase in increments from 0 to 500 cells/ul.
A normal urine leukocyte esterase result should be 0 (negative).
An elevated urine leukocyte esterase can mean that bacteria are present, usually due to a urinary tract infection (UTI). At times it can be due to kidney stones or tumors of the urinary tract.
Urine Dipsticks- A Valuable Screening Tool
The urine dipstick test is a useful screening tests for many systems of the body. It is easy to read, doesn’t require expensive equipment and can be read outside of the clinical setting. Notably, urine microscopic and/or urine culture may still be necessary based on urine dipstick results and any clinical manifestations.